A few days ago, I wrote:
Huge new buzz on Apple and Google.
Google has Google+ and Apple has iPhone5. The buzz on the Internet has ratched up. You can literally feel it.
Fortunately (for me) I took the hint and bought some Google, which last night reported huge higher profits. Google should be up at least 10% today, maybe more.
Yesterday, my friend and reader Pete Rawlings emailed me:
Do you remember I mention buying AZO at one of our lunch dates in La Quinta because I went there to get some brake fluid and the place was packed with people? Well it just hit a new high today over $300. Peter Lynch was right. Buy what you know.
Pete didn’t buy any AZO. And neither did I. We’re both idiots.
Lululemon Athletica (LULU) has a store around the corner from my apartment. It’s always crowded with young adults who care about their bodies and how they look. LULU’s stock has gone through the roof. Ditto for Chipolte, Panera Bread, Sodastream and others whose products we love.
Peter Lynch walked the stores with his kids. They pointed out what was hot and he bought the stocks.
So, what’s wrong with the rest of us? Do we spend our lives in our offices “analyzing” trends and earnings statements. Or do we get out where the action really is — in the street.
That’s my rant for today. It would be nice if every reader went shopping this weekend, found one new product and added it as a Comment on the bottom of this blog. Or send me an email and I’ll go shopping also.
Mr. Bernanke’s version of consistency. One day he tells Congress, he’ll do whatever it takes…
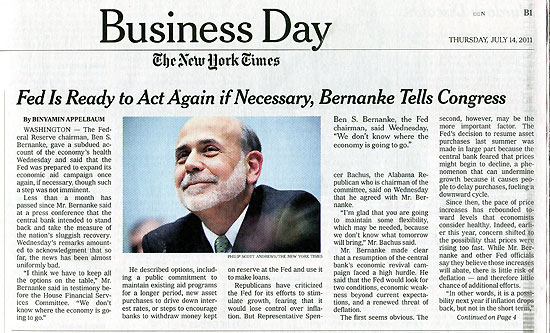
And the market booms.
The next day (i.e. yesterday) he tells Congress nothing will be needed. He won’t be doing anything. And the market tanks.
It makes you pray for him to shut up.
A wise man once said Washington, D.C. was 8-square miles surrounded by reality. It’s worse than that. Look at the nonsense (and wasted energy) going on with incandescent lightbulbs. Incandescent light bulbs are not going away. I’ve checked this out seven ways from Sunday. You don’t need to stock up on incandescent bulbs. The Act that Congress passed several years ago merely does for lightbulbs what Congress had done for cars — make them a little more fuel efficient.
The sad part is that our Congresspeople don’t read. They don’t even read their own Acts.
From the New York Times:
July 9, 2011
Dim and Dimmer
By ROBERT B. SEMPLE Jr.

The House is scheduled to vote this week on a daft and destructive measure that — in the name of individual freedom — would repeal national energy efficiency standards for light bulbs enacted by Congress in 2007. Though utterly without merit, the bill stands a fighting chance in a legislative body where ideology now routinely trumps common sense.
The standards, approved with bipartisan support as part of a broader energy bill signed by President George W. Bush, require new bulbs to use 25 to 30 percent less energy than traditional incandescent bulbs starting next year, and 65 percent less energy by 2020. Though the standards are likely to encourage wider use of compact fluorescent bulbs and newer high-efficiency light-emitting diode bulbs (LEDs), they do not ban incandescents, as some politicians have claimed; they simply require them to be more efficient.
The long-term benefits, according to the Natural Resources Defense Council, could be huge: national energy savings equivalent to 30 large power plants; household savings of up to $200 a year; and 100 million fewer tons of carbon dioxide pollution yearly, roughly the amount from 17 million cars. So far, not a single manufacturer has complained — G.E., Philips and Sylvania already sell bulbs that meet the 2012 standards.
This has not stopped House Republicans like Joe Barton, who says his Better Use of Light Bulbs Act (BULB) is an antidote to “Washington mandated” infringement on consumer choice. Rand Paul, sponsoring a similar bill in the Senate, has been even more colorful, telling a startled Energy Department official at a Senate committee hearing, “you favor a woman’s right to an abortion, but you don’t favor a woman or a man’s right to choose what kind of light bulb.” What appears to have escaped these freedom-fighters is that the 2007 law actually expanded consumer choice, which has largely been limited to a technology essentially unchanged since Thomas Edison.
Im not giving up on Annaly. It is the best-managed of the mortgage REITs. I perceive its latest $2 billion share sale as positive. And I like it’s 14.5% dividend yield (at last night’s closing price). Yesterday Annaly released its Market Commentary for the Second Quarter 2011. Here it is:
NEW YORK–(BUSINESS WIRE)– Annaly Capital Management, Inc. (NYSE: NLY) released its second quarter 2011 market commentary providing a review of the economy and the residential mortgage, commercial mortgage, asset-backed, corporate credit and treasury markets. Through its quarterly commentary Annaly expresses its thoughts and opinions on issues and events it monitors in the financial markets. Please visit our website, www.annaly.com, to view the complete commentary with charts and graphs.
Economy
There was a marked deterioration of economic indicators in the second quarter, followed by downgrades of current and future quarterly GDP estimates by the Federal Reserve (the Fed) and private forecasters. The Citigroup Surprise index for the US, which measures the variance of economic data from their estimates, experienced its largest swing since the 2008 crisis, moving from near +100 to near -100 (available in our online version). Fed manufacturing surveys from Philadelphia to Dallas to Chicago showed large declines in activity. The ISM manufacturing survey surprised to the upside, but this was driven almost exclusively by an increase in inventories. The ISM non-manufacturing survey declined, indicating a slowing of service sector growth. Real personal income and spending weakened and retail sales disappointed.
Hiring managers also became more risk averse during the quarter. Initial jobless claims spent all but one week in the quarter above the 400 thousand mark, indicating a still sluggish job market. Nonfarm payrolls saw continuous deterioration throughout the second quarter. Headline jobs fell from +217 thousand in April to only +25 thousand and +18 thousand in May and June, respectively. The unemployment rate increased from 9.0% to 9.2% over the same time period. In June the household survey showed a fall of 445 thousand jobs, which makes the number of people employed essentially unchanged from June 2010 (139.3 million from 139.1 million last year). The number of people working in full-time jobs is actually down slightly from June 2010. The June 2011 report was unambiguously bad (labor force and participation rate down, hourly earnings down, work week down, temp workers down, average duration of unemployment up, etc) and a big disappointment for those hoping that the poor May report was a single hiccup in an otherwise strengthening recovery. What we saw was a serious loss of momentum in the economy.
Much like the failed prediction of the Rapture on May 21, 2011, the end of the second round of Quantitative Easing (QE2) did not mark the end of the world for the Treasury market, though it did remove a powerful support for asset prices in general. Equity prices were effectively flat for the quarter while Treasuries rallied. Home prices continued to sink, and commodities also weakened. Much of the current “soft patch” in economic activity and asset prices is being blamed on lingering effects from the Japanese earthquake/tsunami/nuclear crisis, high gas and food prices, and, more recently, the ongoing sovereign debt crisis in peripheral Europe.
It isn’t only in peripheral Europe where we find long-term structural problems. We find ourselves in the midst of another global cycle of debt growth and debt restructuring, much like past ones, but this time driven by heavy central bank “management” of interest rates and asset prices. The financial and household sectors saw the fastest growth in their debt outstanding of any sector during the last 30 years. These are the two largest segments of the economy, and their ongoing balance sheet contractions should be a headwind to economic growth for some time. This has been a kind of default/restructuring story as well, but with a twist: the full effect of this deleveraging hasn’t been felt because governmental balance sheets have stepped in to soften the blow. Since 2008, household debt has fallen by over $600 billion and financial sector debt is down by a whopping $3.0 trillion. In the same time period, the balance sheet of the Federal Reserve has grown by $2.0 trillion, as illustrated in the graph in chart 1 of our online version.
It is no wonder that when the Fed ends QE2, we see slouching economic data and falling inflation expectations. The Fed and Treasury are not natural buyers and holders of household and financial sector obligations, so the restructuring will need to continue into its next phase: the re-privatization of risk. The markets will eventually need to learn to price risk correctly, in an environment of positive real interest rates and little to no government support of asset prices. We suspect that the transition to the next stage of restructuring in the US, and the eventual restructuring of the debt built up by European peripherals, Brazilian households, and Chinese local governments will not be without pain.
Residential Mortgage Market
Prepayment speeds continue to be stagnant in a housing market still far from recovered. March, April and May speeds (April, May and June release) were flat, down 13% and up 15% respectively. Recent data as reported by CoreLogic suggests there are 1.7 million units in the “shadow” inventory, or five months worth of supply, on top of the 2 million loans that are more than 50% underwater. Given the sheer size of “unrefinanceable” loans, coupled with new mandatory additional loan-level pricing increases on all Fannie Mae/Freddie Mac refinances by FICO/LTV combination, it appears refinancing activity will continue to have the wind in its face.
Macro issues dominated the financial markets throughout the quarter, led by concerns over sovereign debt and the looming end of QE2. However as the quarter came to a close, and austerity measures by Greece were passed and the end of QE2 came and went, volatility gradually abated and the US Treasury market performed well while spreads on Agency mortgage-backed securities ended the quarter roughly where they began. Risky assets have underperformed throughout this period of uncertainty, but the market continues to bid well for high quality liquid assets.
In the second quarter, the Treasury Market Practices Group will be recommending a “fails” charge trading practice for the Agency mortgage market of 2% minus the Federal Funds daily effective rate beginning February 1st, 2012. A “fail” occurs when one counterparty is unable to make delivery of a specified security to another on the originally agreed upon settlement date. Since the implementation of the first round of quantitative easing, the volume of system-wide Agency fails has ballooned as demand dramatically increased and supply waned, as illustrated by graph 2, available in our online version.
A “fails charge”, or penalty, is meant to correct this potentially systemic problem. Counterparties should seek to “clean-up” existing fails to avoid paying the penalty.
Commercial Mortgage Market
Sixteen multi-borrower or conduit pool transactions have closed since June 2010 in a renaissance that is being called CMBS 2.0. The deals total $19.9 billion and are collateralized by 719 loans. While welcomed as a sign of market recovery, this activity is also viewed with suspicion by a market burned by the recent credit crisis. Specifically, has CMBS 2.0 been helped by eroding underwriting standards?
The short answer is no. Looking first at the aggregate composition, transaction sizes ranged from $717 million to $2.2 billion. The average loan size was $27.8 million. By comparison, the average loan size in the pre-crisis benchmark GSMS 2007-GG10 (“GG10”) pool, comprised of 202 loans totaling $7.6 billion, was $37.6 million. While the loan size was obviously larger in GG10, it should be noted that the 10 largest loans in GG10 comprised 43% of the pool. Under CMBS 2.0, the top ten loans now comprise 62% of the pool on average. While there may be ‘lumpiness’ in the pool, the relatively smaller pool sizes and the fact that the transactions are issued under Reg. 144A provide investors ample opportunity for due diligence.
The property types financed under CMBS 2.0 were initially retail, office and industrial. Towards the end of 2010, multi-family and lodging collateral were added to the pools. The most significant concern raised by investors has been that the pools have been weighted towards retail. While the exposure to retail is north of 50%–clearly higher than the 30% average observed during the 2000 to 2008 vintages—retail performed relatively well with the second lowest historical delinquency rate of 7.75%.
To review the underwriting, we’ll focus on debt service coverage (“DSC”) and debt yields. Overall the CMBS 2.0 pools have an average DSC of 1.70x. While there was some pressure on the average during early 2011, recent debt service coverage levels have returned to or above the average. These levels far surpass the 1.31x DSC of GG10. We calculated debt yield based on net cash flow rather than net operating income, a more conservative approach since it incorporates some contribution to capital expenditures. Debt yields are still attractive for both debt and equity.
In summary, CMBS 2.0 appears well underwritten and clearly should outperform when compared to the 2005-2007 vintages. And although we have noted some minor slippages, the transactions are still structured with subordination levels that approximate amounts observed with the 2003 vintage which should provide sufficient credit support.
Asset-Backed Market
Despite concerns about the sovereign debt crisis, the strength of the domestic economy, unresolved regulatory reform and structural changes in securitization, the asset-backed market has rebounded sharply from the crisis period of 2008-2009. According to statistics provided by J.P. Morgan, total US public and private issuance through the second quarter of 2011 is $67 billion, which is 15% higher than the $58 billion in total issuance during the first half of 2010. This increase has mostly been driven by issuance in the auto, credit card and global RMBS segments, although several deals representing the more esoteric asset classes (railcars, container leases and servicer advances) have also come to market, as seen in table 1, available in our online version.
A major theme in the more traditional market segments (credit card, autos and equipment) is that collateral performance continues to improve and technical trends remain favorable, with demand exceeding supply. Bank credit card trusts continue to report strong performance with lower chargeoffs and delinquencies and higher excess spread. The bank credit card segment has benefitted from a strong technical bid due to a lack of new issuance and a flight to quality trade particularly during the last quarter. Through June, there has been only $3.8 billion of bank credit card issuance as the banks have funded credit card receivables more cheaply through deposits rather than through securitization. Investor interest in credit card securities is evident as J.P. Morgan issued two deals this year that were driven by reverse inquiry.
In contrast to credit cards, total issuance in the auto segment through June is $29 billion. Deals are frequently oversubscribed, launch at tighter levels than initial price guidance, and are often upsized to accommodate the strong interest. Demand has been particularly strong in the subordinated tranches from investors looking for incremental yield. Collateral performance continues to improve. For example, the Manheim Used Vehicle Index hit a record high in May, reflecting improving resale values on repossessed cars. This has helped to limit losses in the auto trusts.
Similarly, the equipment sector has also enjoyed strong demand. Issuance through the end of June is $4 billion, which is 60% higher than the $2.5 billion issued during the first half of 2010. Collateral performance has been strong, particularly in the agricultural segment. The additional supply has been met with very solid demand as evidenced by a $200 million upsize in a recent deal.
Due to strong collateral performance, stable quality ratings, and attractive yields relative to like-rated alternatives, the asset-backed market should continue to provide attractive investment opportunities for those willing to do their homework.
Corporate Credit Market
Micro and macro are once again at odds. This type of backdrop generally serves as a source of frustration for corporate credit investors, who prefer the “cleaner” micro-level analysis. The dichotomy also served as a key source of volatility for credit in the first half of the year, which was broken into two distinct parts. In the first, material optimism due to tax cut extensions, QE2 stimulus, and continued robust earnings buoyed credit. In the second, weak housing, tepid growth, and Europe sovereign woes weighed on credit. Despite the volatility, credit across all segments managed to post respectable returns.
Technically speaking the first half was an excellent time for credit. Demand for the lower risk segments of credit —investment grade corporate bonds and leveraged loans—remains brisk coming off the first half. Net mutual fund inflows for each have been $24 billion and $35 billion YTD, respectively. On the loan side, permanent capital vehicles have returned: 14 new collateralized loan obligations (CLOs) came to market totaling $6.5 billion; Business Development Companies (BDCs) raised $2.8 billion of proceeds in 22 separate public equity offerings; and we count at least two new closed-end loan funds. Despite a record-size weekly outflow in June, high yield bond fund flows have stabilized. Investors want to be long risk: According to Morgan’s Stanley’s 6 July 2011Global Credit Survey, 45% of US investors expect to add credit risk over the next three months. This compares to 29% in the last survey.
Supply set new records year-to-date. While debt refinancing remains the primary use of proceeds, companies are finding alternative uses at the strongest pace since the credit crisis. In investment grade bond issuance, debt-financed M&A and share repurchase programs are taking a larger share of supply. Likewise, in leveraged finance, dividend recaps, capital expenditures, and M&A are at the highest share since the crisis. As a result, leverage loans outstanding has stopped declining and net bond supply trends— as measured by the par value of Bank of America/Merrill Lynch’s Investment Grade and High Yield bond index— are picking up. Par debt outstanding is up $303 billion this year, which compares to a $229 billion rise in 2010.
At the same time, corporate credit spreads are outperforming on a relative basis. The credit ratings of European peripheral sovereign debt are falling like dominos. Recently, Portugal was downgraded to double-B at S&P, and Moody’s put double-A Italy on CreditWatch negative and downgraded Ireland to double-B. Compared to these sovereigns, credit risk in the US looks relatively benign, with excellent liquidity, cash flow and asset leverage. In chart 3 in our online version we compare High Yield to the average spreads of the peripheral sovereign credits (with and without Greece).
Treasury/Rates Market
The second quarter brought quite an about-face in the Treasury market. From the early part of April until the latter part of June we saw a nearly straight line rally in yields to the tune of 100 basis points (bps), only to give back a decent portion of those gains in the last week of the quarter. When all was said and done, 2-year Treasurys were 42 bps lower in yield or richer, 5-year Treasurys were 64 bps richer, 10-year Treasurys were 35 bps richer, and 30-years were just 15 bps richer. The theme of the quarter was downside economic surprise with a healthy dose of European sovereign debt woes.
Chart 4 in our online version plots the Citi US Economic Surprise Index and demonstrates the magnitude of the drop historically. The Index tracks cumulative degrees of upward and downward surprises in US economic releases weighted both to relative significance and timeliness. The peak to trough drop was on par with that of the 2008 crisis itself. Ultimately, economic data disappointed like clockwork relative to economists’ expectations. Some of this can be attributed to supply chain disruptions as a result of the Japanese earthquake and effects of higher energy prices with unrest in the Middle East and North Africa, but the point is clear – it was an ugly second quarter, at least compared to what many expected.
During the second quarter, the Treasury auctioned $517 billion in nominal notes and bonds. The auctions for April and May were mixed: The consecutive 2-, 5-, and 7-year auctions at the end of May all came to market fairly strongly, but the tone of the auctions soured in June as 5 of the 6 auctions priced cheap to market levels when bids were submitted.
With the end of quarter also came the well-advertised end of QE2 (excepting the reinvestment of paydowns and maturities to keep the Fed’s portfolio stable). While the debate remains alive about the effects and benefits of QE, and in this case the impact on Treasury yields, the impact on broader financial conditions seems hard to dispute. Chart 5 in our online version shows the Bloomberg US Financial Conditions index. This index is a barometer composed of fixed income yields, yield curve spreads, credit spreads, and equities. While the direct impact of QE on rates is perhaps inconclusive, the impact of both phases of QE are fairly obvious when looking at broader financial markets, as the Fed’s desired substitution effects were very much in play.
Investigating the Dreaded ‘Check Engine’ Light. File this New York Times piece to read the next time your stupid Check Egine light comes on. Know two things: First, most likely the problem is with your gas cap. Clean it or replace it. Second, your car won’t pass inspection if the light is on.
The Dreaded ‘Check Engine’ Light.
Few automobile problems are more vexing than the “check engine” light. When the light comes on, it may mean you simply didn’t tighten your gas cap enough after filling up – or it could mean there’s major trouble brewing in your catalytic converter. George Ruhe for The New York Times
CarMD.com, a seller of do-it-yourself tools to help you diagnose problems with your car, has compiled a list of the most common reasons the “check engine” light comes on, based on its database of engine repair information, which is compiled by automotive technicians. (They receive a fee in exchange for contributing data.) Art Jacobsen, the company’s vice president, said it is important to find out why the light is on because “small problems can lead to big price tags” if necessary repairs aren’t completed.
Here’s the list:
1. Replace the oxygen sensor. The sensor is a device that measures oxygen in the car’s exhaust and helps regulate how much fuel the engine needs to operate. If it’s faulty, it will make the car use more fuel than needed – and end up raising your fuel costs as much as 40 percent, Mr. Jacobsen said. “The vehicle will run fine, but it will inject more fuel and you’ll buy it more often,” he says. Replacing the sensor usually costs less than $200.
2. Inspect for a loose or cracked gas cap. If you don’t tighten the gas cap enough, or if it’s broken, gas can evaporate into the air, wasting fuel. A new gas cap typically costs less than $3.
3. Replace the catalytic converter. The catalytic converter reduces toxic emissions and can be an expensive (as much as $2,000) repair. Typically, this part won’t fail unless you repeatedly ignore problems with faulty oxygen sensors or spark plugs. So its ranking suggests a lot of routine repairs aren’t getting done.
4. Replace the mass air flow sensor. This device measures air coming into the engine. Problems here can be prevented by changing the air filter when you have your oil changed – for a cost of about $20. If you don’t, and dust builds up on the sensor, you could be in for a $400 repair.
5. Replace the spark plugs. Changing spark plugs typically costs a few dollars a plug if you do it yourself. Again, if not replaced, damaged spark plugs can cause the engine to misfire and lead to expensive catalytic converter problems.
Generally, if the “check engine” light comes on you can safely drive the car until you are able to stop and check the gas cap or take it in for servicing. If the light is flashing, however, the problem is probably serious and you may do mechanical damage by continuing to drive, Mr. Jacobsen said.
If you’re a do-it-yourself type, CarMD sells handheld diagnostic devices ($119 plus shipping, online) that plug into a standard data port, found in all cars 1996 and newer. (Our Automobiles section tried the device a few years ago.) After you tap the car for its data, you download it to your computer, and access online information to help you figure out what may be wrong with your car as well as estimate the cost of repairs. CarMD’s Web site has a tool that lets you search by make and year to find where the port is located in your car. It’s often behind the steering wheel.
The pay increase
A Mexican maid asked her female boss for a pay increase. Her boss was annoyed and asked, Tell me Maria. Why do you want a pay increase?
Maria: ‘Well, Señora, There are three reasons why I want an increase…
The first is that I iron better than you.’
Wife: ‘Who said you iron better than me?’
Maria: ‘Your husband said so.’
Wife: ‘Oh.’
Maria: ‘The second reason is that I am a better cook than you.’
Wife: ‘Nonsense, who said you were a better cook than me?’
Maria: ‘Your husband did.’
Wife: ‘Oh.’
Maria: ‘My third reason is that I am a better lover than you..’
Wife (really furious now): ‘Did my husband say that as well?’
Maria: ‘No Señora, the gardener did.’
Wife: ‘So how much do you want?

Harry Newton who gets things confused in his old age. I meant Vancouver Island, near Vancouver, Canada. I did not mean Victoria Island, which is nowhere near Vancouver, and worse, is bloody cold, being 2,000 miles north of Vancouver. The big city on Vancouver Island is called Victoria. I think the Canadian logic is akin to why they called Iceland Iceland and Greenland Greenland, when Iceland should have been called Greenland and Greenland should have been called Iceland. Check. Check. Check.
I’m in Portland, Oregon visiting Michael and participating in this weekend’s Cycle Oregon. If you’re biking, look me up. I have a black helmet and I’m walking the hills.

See if this gets through the systems:
http://www.youtube.com/watch_p…
That's: http://www.youtube.com/watch_p…
It may be obvious I'm not a fan of the NYTimes. All too often, they support big government and further government rules and regulations. Perhaps they should expose more about government's waste and foolishness as this UTube does so well. It's your taxes.
http://www.youtube.com/watch_p…
Enjoy!
The “Dim and Dimmer” headlines should be applied to the whole ridiculous NYTimes article, aimed as usual at the dim and dimmer folks who read and buy into the highly biased Times' positions and articles. You said it some time ago, Harry, that light-emitting diode bulbs and fluorescent bulbs are dangerous if broken and a problem for disposal. If increasing light bulb efficiency is so doable with incandescent bulbs, why hasn't traditional competitive business practices brought about these improvements?
Welcome to Portland! Enjoy the weather, city and food. Our laid back attitude will help re-energize you before you return to NYC (I lived there for 3 years).