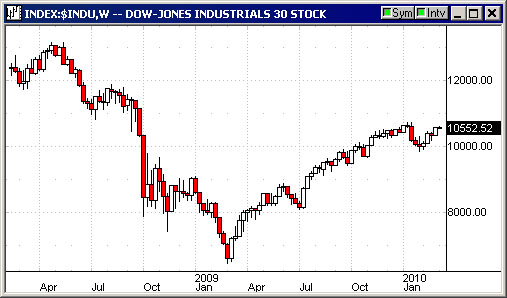
Today is the one-year anniversary of March 9, 2009 Bull Market. This is what happened:
What now? Take Google, for example:
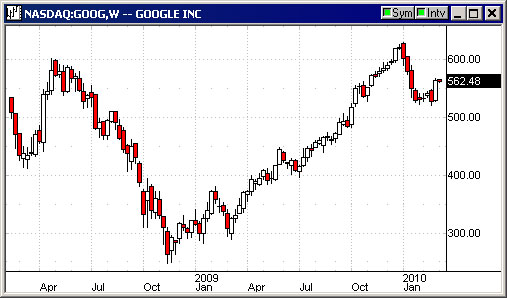
Is it hesitating? Is it ready for the next bound up to its previous high of early January?
My friends tell there are huge monies sitting in cash, awaiting some divine signal.
It’s a weird world. All logic suggests interest rates should much, much higher.
We’ve been waiting for much higher interest rates for two years. But interest rates just keep falling, and falling. Yesterday I checked a Vanguard Short-term muni bond fund I’ve been parking some money. The thing is paying an insulting 0.01% a year. Invest a million dollars. At the end of a year we’ll have $1,000,100. The amount is so little I did the maths three times this morning. I couldn’t believe the number.
Richard Russell of Dow theory Letters, who likes gold and lately has been bearish, writes last night:
March 8, 2010 — “The nonpartisan Congressional Budget Office said Friday that based on the Obama administration’s budget proposal, deficits over the next decade would be $1.2 trillion higher than the White House estimated.”
The estimates of budget deficits are so huge that they defy the ability of the average citizen to comprehend them. As the US continues to create more dollars, at some point our foreign creditors are going to want higher returns (rate) before they are willing to make loans to the US. Rising rates would be an extreme danger to the US. Not only would they would hurt business. Rising interest rates mean a rising cost of carrying the national debt. The process of compounding the cost of the national debt would send US finances into a “death spiral.”
I think institutional investors are holding off on buying stocks because they don’t see stocks as safe long-term holdings. Big money investors are looking ahead to higher interest rates. That combined with current high valuations for stocks constitutes a red flag for seasoned investors. The key here is probably the action of the bond market, and particularly long-dated Treasury bonds. The 30-year T-bonds would be particularly sensitive to Treasury financing looking years ahead.
It is still not clear how the US is going to finance its enormous national debt. Renege on the debt is unthinkable. To raise taxes and at the same time cut down on spending is almost an impossibility. That leaves inflation as the most probable answer. As soon as our creditors realize that our “way out” is inflation, they will halt their process of lending to the US, or at least halt lending at current low, low rates. …
What to do — You’re a sophisticated, wealthy investor. You just received five million in cash, and you wonder what to do with it. The cash is at Morgan Stanley in their money market fund. You’re receiving zero interest on your five million. And worse, you’re seriously worried about the dollar, which is what your cash is in. You’re afraid of bonds, because you see interest rates heading higher. You’re afraid of the dollar because the US National debt is over $12 trillion. What the hell, you might as well buy a collection of blue chip Dow stocks, all of which pay dividends of 3%. Hopefully, these Dow stocks will continue to climb and continue to pay dividends, thus off-setting any decline in the dollar.
Of course there are alternatives, CDs, but you don’t want to spread your money out in 50 different banks and again your money would be in dollars. How about bonds in emerging market nations? Too hard to follow, and too risky. You’ll stay with your Dow stocks, and keep your fingers crossed. If they start to turn bearish, you’ll dump them in a hurry. There is also income producing real estate or foreclosed real estate. How about real estate? But problem — you don’t trust all the BS about “the bottom being past” in housing. Besides, if you have rental property, it can be a time-consuming pain finding a renter. And what if this isn’t the final bottom for housing?
The Wall Street Journal “celebrated” the one year anniversary with this piece:
Worries Rebound on Bull’s Birthday by E.S. Browning
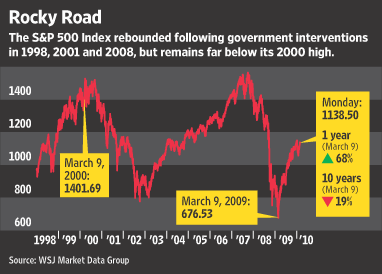
March 9, 2020: Investors celebrating the new bull market’s first birthday on Tuesday may remember a less happy milestone on Wednesday: the 10-year anniversary of the peak of the technology-stock bubble.
The great debate among stock-market analysts these days is whether the market has finally worked off years of excessive prices and can return to steady growth.
Optimists argue that two brutal bear markets have left stocks cheap and attractive, especially if the government’s economic-recovery initiatives succeed. They say investors who were too optimistic in the 1990s are too pessimistic now, and that a recovery in corporate performance could offer investors happy surprises.
But some of those who warned of trouble a decade ago are worried again today. They say government interventions in the economy and the market in 1998, 2001 and 2008 kept stocks from fully correcting. Some see signs of bubbles starting to inflate again, notably in certain developing-country stocks.
This uncertainty has fueled a prolonged debate between two old friends, renowned economists Robert Shiller and Jeremy Siegel. They say they’ve been chewing over the issue during vacations together at the New Jersey shore. Mr. Shiller, a Yale University professor whose book “Irrational Exuberance” warned of the tech bubble just before it burst in 2000, still worries about the market’s future. Prof. Siegel of the University of Pennsylvania’s Wharton School, whose book “Stocks for the Long Run” was the bible for many investors in the 1990s, is bullish.
Each of them can marshall a slew of data to bolster his viewpoint. Their reputations as forecasters may be affected by which of them winds up being correct.
The past decade has been a lost one for stock investors. The Dow Jones Industrial Average finished Monday at 10552.52, up 61% from the recession low a year ago, about halfway back to its record high of 14164.53 in October 2007. The blue chips are trading at a level they first reached in April 1999.
One concern of pessimistic analysts such as Mr. Shiller is that despite the two bear markets, stocks have spent almost all their time since 1991 priced above historic averages. History suggests that when stock prices are high, performance in ensuing years is disappointing.
None of these analysts is predicting another decade as bad as the last one: The market today is a long way from the price excesses of 2000. They aren’t predicting when the market will run into trouble. Sooner or later, they contend, perhaps when the government’s heavy stimulus wanes, stocks could face disappointing returns and even some scary ups and downs.
“One decade’s damage still hasn’t brought us back down to historic norms” for stock prices, says Robert Arnott, who warned of trouble in 2000 and whose firm Research Affiliates in Newport Beach, Calif., directly manages $4 billion. Previous stock bubbles were followed by long periods “with the market priced at deep discounts,” when investors gave up on stocks, which hasn’t happened this time, Mr. Arnott says.
The government intervention dates back to the Russian debt default and stock-market swoon of 1998, when the Federal Reserve stepped in to cut interest rates and prop up shaky financial markets. U.S. stocks collapsed again in 2000, leading to heavier government support and interest-rate cutting starting in 2001, especially after the Sept. 11 terrorist attacks. Stocks fell even harder in 2008. Central banks world-wide injected trillions of dollars into the financial system, pushing target government interest rates close to zero.
Markets were rebounding last August when Messrs. Shiller and Siegel got together with their wives at Mr. Siegel’s beach house on a barrier island, below Atlantic City, N.J. They have been friends since graduate school at the Massachusetts Institute of Technology in the 1970s. As they walked the beach for hours, they discussed the market, its prospects and the best ways to analyze it.
Mr. Shiller worries that the housing market could be turning down after a brief recovery, which could contribute to a decline in U.S. stocks, which already look expensive to him. “I wonder about a return to another break in the market,” he says, though he notes the market is far less expensive today than when he wrote his book.
Mr. Siegel scoffs at his friend’s concerns—and at his numbers. “This is an extremely cheap market,” he says, and its future is bright.
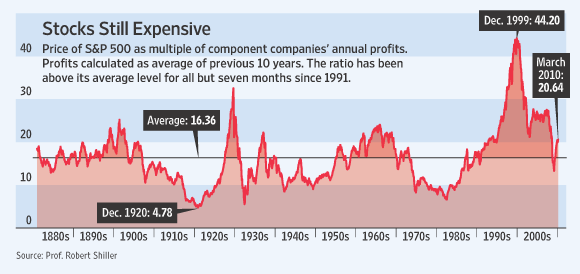
Mr. Shiller has compiled market data back to 1881, measuring stock prices month by month relative to corporate profits. To avoid short-term profit distortions, he uses an average of profits over the previous 10 years. Over the long run, by his measure, stocks trade at an average of about 16 times annual corporate profits—that is, their price-to-earnings ratio, or P/E ratio, is about 16.
He has found that when this ratio has gotten above 20, as it is today, it has signaled that the market was expensive and sooner or later would hit a stretch of subpar returns. Adjusted for inflation, stocks have declined on average about 2% a year in the decade after they hit a P/E of 20, Mr. Shiller has calculated. When dividends are factored in, they have notched a small positive return. Eventually, the P/E ratio has always fallen back below the average level, after which the market becomes cheap, paving the way for above-average performance.
The way Mr. Shiller sees it, the problem today isn’t just that the current P/E is above 20. It is that since 1991 it has spent only seven months, in late 2008 and early 2009, below the average level of 16. At the start of 2000, it was above 40. No one can say how much longer the P/E can keep rising or when the past year’s bull market might end, especially with the government providing heavy stimulus. But past trends, and the law of averages, suggest that at some point the P/E is likely to fall below 16, pulling stocks with it.
Mr. Siegel, for his part, strongly disagrees with this kind of analysis. He argues that his friend’s use of 10-year average profits works poorly in the current environment, because big financial companies took such heavy write-offs in 2008 and 2009. Such write-offs, he argues, won’t be repeated, so earnings including them shouldn’t be used for forecasting.
“AIG’s $80 billion write-off is going to pollute those figures for 10 years,” as long as they contribute to the 10-year earnings average, he says.
Mr. Siegel prefers to look at analysts’ projections of future earnings, adjusted to exclude special write-offs and charges that he and the analysts think are unlikely to recur.
Mr. Siegel’s book also looks at long-term stock performance back to the 19th century. He finds that of all investments, stocks turn in by far the best long-term results, with an average inflation-adjusted return of 7% a year.
At times like the present, with profits rebounding, they do even better than average, he says.
“My research shows that the common P/E is 18.5” when the economy is coming out of a recession, he says. The way he looks at it, the market now is trading at about 14.5 times forecast 2010 profits, making it cheap compared with the typical P/E of 18.5. If stocks rise to 18.5 times profits, the S&P 500 could rise to 1400 this year, a 23% gain from today’s level, he notes. “We could easily see 10% to 12% stock returns with low inflation” in future years, he says.
Mr. Shiller doesn’t agree with his friend’s analysis of P/Es and write-offs. The impact of recent write-offs on the 10-year averages is small, he argues. As for trusting analysts’ forecasts, adjusted to exclude write-offs, he says: “Those are famous last words.”
Another market analyst who was correctly bearish in 2000 backs up Mr. Shiller’s views. Ben Inker, director of asset allocation at Boston money-management firm GMO LLC, crunches the data in a way that avoids the debate over 10-year averages and write-offs. He uses historical profit margins to forecast future corporate profits.
One problem in forecasting earnings, he says, is that the Internet and real-estate bubbles pushed corporate profit margins to 7%, above the historical level of 6%. The higher profitability was due to exceptional borrowing and investment by corporations and consumers. While that one-percentage-point difference seems small, it represents a 17% jump in profitability, which Mr. Inker considers unsustainable.
Using the historical 6% margin and applying it to an expected rise in corporate revenues as the economy recovers, he finds that stocks today trade at almost 19 times expected profits, making them expensive. To be reasonably priced, he calculates, the S&P 500 would have to fall 21%, to about 900 from Monday’s 1138.50.
“The market should spend a good portion of its time trading below fair value, to match the time it spends trading above fair value,” Mr. Inker adds. “We would bet that something is going to happen to push the stock market below fair value in the next few years.”
One possible catalyst for trouble is the withdrawal of government stimulus, which put a floor under stocks a year ago. The worry is the market has grown so dependent on government help that any effort to wean it off that aid, no matter how slow, will expose its weak underpinnings. Another worry is that before the stimulus can be withdrawn it will set off another destructive bubble.
Some investors see signs of bubbles in developing markets, particularly in China. “The history of emerging markets is filled with booms and busts. You can’t rule out the risk of a new bubble,” says Keith Walter, who helps manage $53.5 billion at Artio Global Investors, formerly known as Julius Baer Investment Management. He’s begun trimming his funds’ once-heavy exposure to developing countries such as China and Brazil.
The emerging-market bubble, if there is one, is just beginning to inflate. Mr. Walter is particularly worried about China’s effervescent property market, where investors are flipping unoccupied apartments in a way reminiscent of the U.S. housing bubble. He fears that local banks with real-estate loans could suffer. “We are worried that it has already gone too far, and that it is going to be a bubble that bursts,” he says.
The Chinese stock market is another cause for concern. Shares of Baidu, often called China’s Google, have quintupled since their late-2008 low and now trade in the U.S. at 85 times the company’s profits for the previous year. Google Inc. itself, a more sophisticated world-wide competitor, trades at 27 times profits, having merely doubled in price from its late-2008 low—and some U.S. analysts consider that excessive.
PetroChina, China’s version of Exxon Mobil Corp., has a market value of about $345 billion based on its Shanghai price, above Exxon’s $315 billion, though it is half as big in terms of revenue.
Yet many investors talk of China’s prospects in a way reminiscent of the tech and real-estate bubbles.
Deutsche Bank has nearly doubled its forecast for Chinese export growth to 30% this year, from 16%. “China is arguably one of the most promising investment cases in today’s global equity market,” said a Goldman Sachs report in late February.
Mr. Walter counts himself a long-term emerging-markets bull. Even if the stocks decline, he says, he expects them to move higher eventually.
But economic prospects are different than stock prospects. Back in 2000, tech-stock bulls argued that Microsoft Corp., Cisco Systems Inc. and Intel Corp. deserved enormous stock prices because they would be lasting world leaders. The companies indeed have remained world leaders, but their stock prices on average are about 60% below their 2000 highs.
Why you can’t always see all the graphs. WordPress is the software which now runs this web site. You can see three columns. When you log on, your computer takes my WordPress code and tries to show it best on your screen. WordPress instructs your computer to show the left and right hand columns exactly and to mush the middle column into whatever space it has left on your screen.
These days most screens are at least 1024 pixels wide by 768. If your screen has these dimensions, your center column will definitely be truncated. The solution is quite simple — Hit Ctrl – (i.e. Ctrl minus). That will shrink everything on your screen and you’ll be able to see the charts and the cartoons in ttheir full glory.
There is another choice. Buy yourself a second monitor. I notice that TigerDirect.com is selling a 19″ monitor for only $99. This thing is 1366 x 768 pixels. It will show this column perfectly — without the need for reducing typesize (i.e. hitting Ctrl minus).
All laptops and desktops will happily run a second monitor without the need for extra software or hardware. Having a second monitor is a joy. You can put your email on one and browse the Internet with the other. You can scissors and paste from one monitor to the other.
A second monitor makes life a lot easier. Trust me.
Internet Email Warning:
If you get an email titled “Nude photo of Nancy Pelosi,” don’t open it…
It contains a nude photo of Nancy Pelosi.
(Sorry about that. I thought it was funny.)

Harry Newton, who remains cautiously bullish. I like stocks that drop, like Google did recently. I wait for pullbacks. Keep those stops tight — perhaps 8% to 10%. This is more of a trader’s than an investor’s market. Keep plenty of cash. Watch for bargain real estate. It is being dumped by desperate sellers. Finding it is not easy. You got to keep looking, and looking and kissing a lot of frogs.

“Mr. Siegel’s book also looks at long-term stock performance back to the 19th century. He finds that of all investments, stocks turn in by far the best long-term results, with an average inflation-adjusted return of 7% a year.”
We used to manufacture our own goods in the USA and now China makes them, so how can we compare stocks of the past to stocks today?
You are correct to point out that this is a trader's market. Investors beware. One has to wonder, in truth, if we will ever return to an investor's market. Which is another way of asking if buy-and-hold can be resurrected from the wreckage of the past decade or if financiers will retrench and kill off the Wall-Mart business model. As for Professor Siegel's “all-in,” efficient market model, I view this as dangerously convenient thinking which the professor has pushed for years. Let's not forget that Professor Siegel, along with Mr. Cox of the SEC, and with the endosement of Phil Gramm, convinced an economically astute George Bush to kill the up-tick rule. Killing the rule would make markets more efficient, according to Professor Siegel & company. We all know how well that idea worked out. Nor was Professor Siegel a fan of Glass-Steagall. He lectured on the removal of G-S as a means of expanding equity and boosting tier-one capital. Two years ago, I cringed at Professor Siegel's association with then-ETF upstart “Wisdom Tree.” It seemed clear that the professor was making a leap from his top 50 stock picks to an ETF-configured portfolio which was every bit as volatile, if not more so. His initial top 50 picks were spread over a period of 50 years, from 1950-2000, an unusually profitable period in the U.S. But a half century is hardly a fair, workable moving average I repeat: Harry is on the mark: This is a trader's market. All others should be patient, hold plenty of cash, make small hedged bets, and be wary of the “all-in” stock crowd which Professor Seagal cheers from the sidelines. About emerging markets: if you're a trader, buy some puts and remember the old Wall Street axiom that gold ends in a pool of tears.
Harry-
Your suggestion that your readers buy a second monitor in order to see your charts and graphs is laughable. I view multiple websites daily- many are investemnt related and have charts and graphs. Only your site (which I view only occasionaly view now) has graphs and charts that are incomplete and squeezed down. Instead of your readers buying a second monitor- which is a ridiculous suggestion- perhaps you should dump WordPress for another software provider. As you described – WordPress keeps the right and left columns in tact and aqueezes down the middle. In effect your advertisemnts on the outside columns are uneffected but the content is compromised…BRILLIANT!!!!!
Agreed. Harry, you constantly mention that companies do not listen to their customers, and although the viewers of your website are not customers per say, without them, there would be no point in you continuing on with your daily blog. And yet they are the ones required to make changes (even spend money!) to simply be able to view your site properly, because you choose it seems to use some pretty ordinary software. Sigh!….
On target jonny b. Mr. Newton seems to be falling to the way-side. Perhaps to many slaps with a cold fish.